Jay Parsons has been one of the most rigorous and widely cited voices in rental housing economics for over a decade. When he publishes a mid-year assessment of the apartment market, it is worth reading carefully – not because he's optimistic or pessimistic by disposition, but because his analysis is consistently grounded in the actual data from CoStar, RealPage, Apartment List, and other primary sources that most investors never access directly.
On July 9, 2026, Parsons published his mid-year read under a telling headline: "Is Multifamily Finally Turning the Corner?" His answer is a careful but clear yes. After more than three years of supply-driven pressure on occupancy, rents, and NOI, five converging data signals are pointing in the same direction for the first time since 2021. The market is not yet healthy. There is still a significant hole to dig out of following the largest supply wave since the 1970s. But the direction has changed – and for disciplined investors who understand what cycle timing actually means for returns, that change in direction is exactly what the entry thesis has been waiting for.
Here is a full-picture analysis of Parsons' five signals, the supporting data from RealPage and CoStar's Q2 2026 releases, and what the inflection point means specifically for multifamily real estate investing in our target markets.
1) Signal One: Supply Is Finally Falling – And It's Real
Parsons leads with the most foundational variable in apartment market analysis: new supply. His assessment: "Following the historic supply wave of 2023-25, completions in the first half of 2026 totaled about 150k units (similar to pre-COVID norms) and it's trending further down." That is a remarkable statement. We are back at pre-COVID delivery norms after the largest apartment construction wave since the 1970s, and the trajectory is still downward.
RealPage's Q2 2026 Data Update provides the supporting numbers. Annual deliveries through Q2 2026 fell to 340,200 units – the first time in three years that annual deliveries dropped below the decade average. This decline is now six consecutive quarters running from the 2024 peak of 588,000 units. The volume of new units delivered in Q2 alone was 77,700 – a fraction of the quarterly volumes that defined 2023-2024. The pipeline that drove so much competitive pressure is genuinely and measurably shrinking (RealPage Q2 2026 Data Update).
Parsons is careful to note that "there are still plenty of 2024-25 completions still competing to lease up and stabilize" – meaning the current inventory isn't gone, just no longer growing at the pace that created the problem. This is an important distinction: the supply wave has broken, but the residual pool of recently-delivered units still working through lease-up continues to create competitive pressure in certain submarkets. That pressure is diminishing, not vanishing overnight.
The census data we covered last week reinforces this picture further: total housing starts fell to 1.177 million SAAR in May 2026 – the lowest since May 2020 – with multifamily starts plunging to 295,000. Units under construction have fallen from over 1 million in December 2023 to 679,000 in May 2026 (Census Bureau/HUD, June 16, 2026). The pipeline the market will be absorbing 12-24 months from now is dramatically smaller than what it absorbed over the past two years.
Investor takeaway: The supply cycle has genuinely turned. The lagged effects of the construction slowdown – fewer competitive deliveries, faster absorption of the existing pool, improving occupancy in stabilized properties – will play out over the next 12-24 months. Stabilized, well-located communities are at the front of the line to capture those improvements.
In simple terms: For the first time in years, fewer new apartments are arriving on the market each quarter. We're back to pre-pandemic delivery levels, and the pipeline of future projects is even smaller. When there are fewer new apartments to choose from, the ones that already exist and are running well become more valuable. That process is already underway – the supply tide has turned.
2) Signal Two: Demand Held Stronger Than Anyone Expected
The supply story was widely anticipated. The demand story is where the data genuinely surprised the market – and it is arguably the most important signal Parsons identifies.
Parsons writes: "Despite all the headwinds (choppy job market, higher unemployment among recent college grads, re-accelerating inflation, low consumer confidence, etc.), we continue to see absorption levels way above normal." Both CoStar and RealPage reported 1H 2026 net absorption topping 250,000 units – which Parsons notes is "higher than any year prior to COVID." That is a striking data point. In the face of macro uncertainty that would typically suppress household formation and leasing activity, apartment demand continued at an above-historical pace.
RealPage's Q2 2026 standalone data is equally encouraging: 187,000 units absorbed in Q2 alone, outpacing seasonal expectations. National occupancy rose to 95.5% – a modest but meaningful improvement for the second consecutive quarter. New renter households who pay approximately 21-22% of income toward rent – within healthy affordability norms – are the composition of that demand (Jay Parsons, July 9, 2026; RealPage Q2 2026 Data Update).
Why has demand been so resilient? The structural drivers we've covered throughout 2026 remain firmly in place:
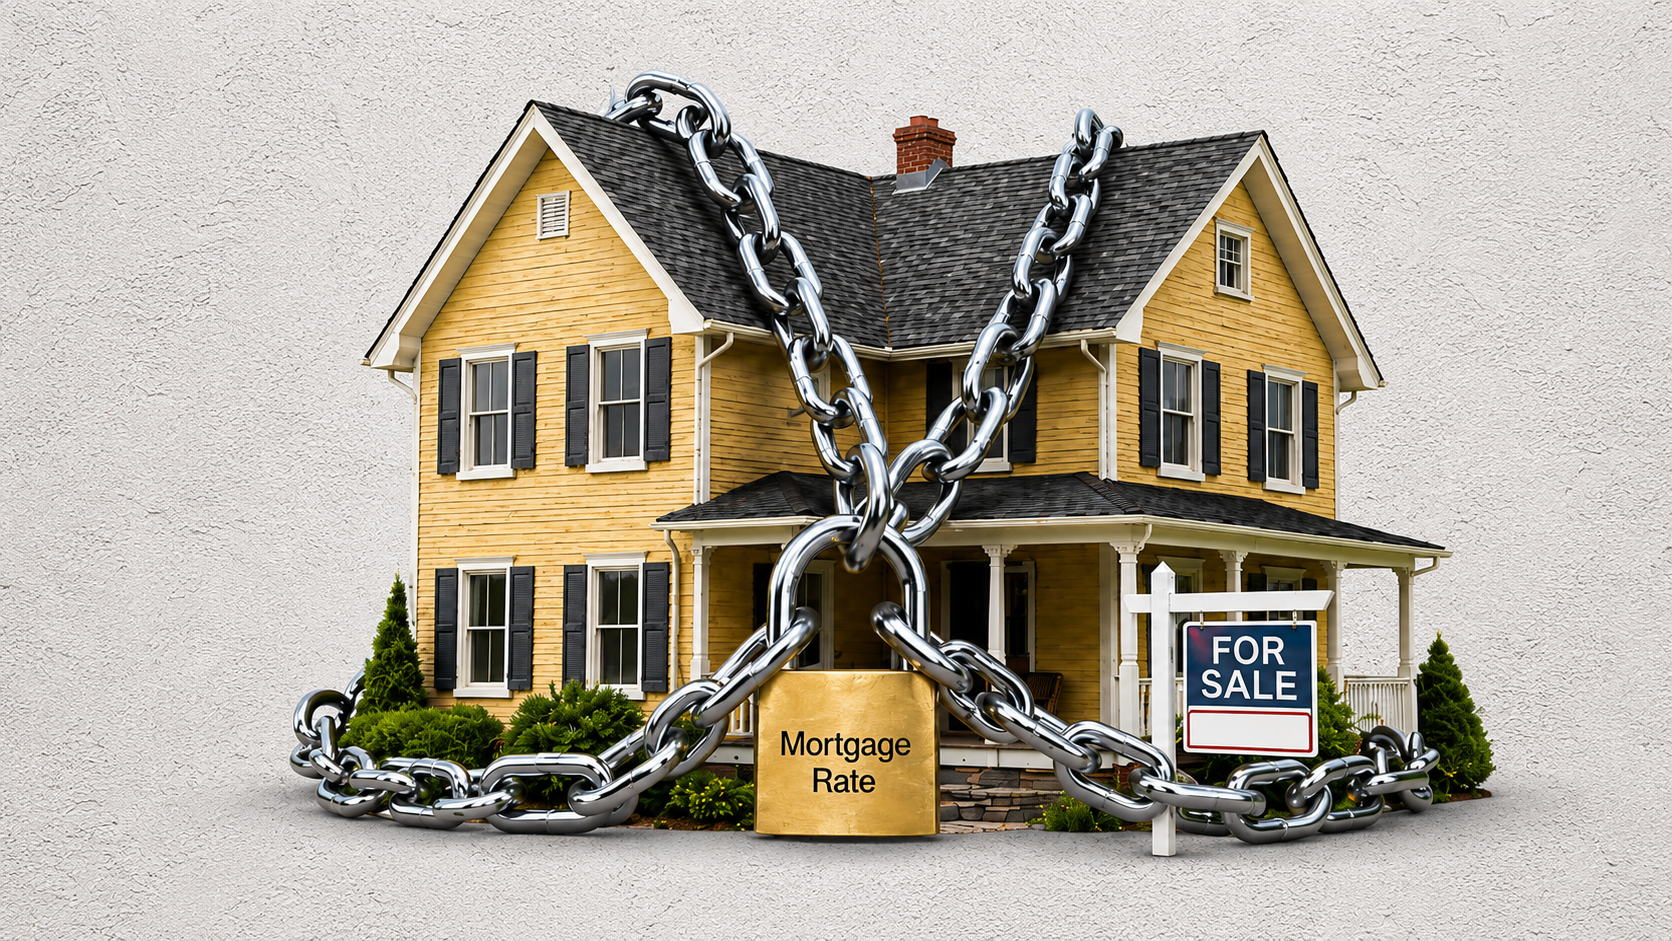
- The mortgage lock-in effect keeps millions of would-be homebuyers in the rental market. As of Q4 2025, more than 50% of all outstanding U.S. mortgages still carry rates below 4% (FHFA/Wolf Street). With 30-year rates above 6.25%, the payment math of selling and rebuying discourages the transitions that historically generated apartment turnover into homeownership.
- Wage growth topping rent growth for 41 consecutive months. As Parsons noted in a recent LinkedIn post, renter affordability has actually improved meaningfully – with rent-to-income ratios returning to pre-pandemic levels. Renters earning 21-22% of income on rent are in comfortable affordability territory that supports continued payment performance and renewal decisions.
- Household formation continuing despite headwinds. Harvard JCHS reported a record-high 784,000 new apartment households formed in Q2 2025. Even as that pace has moderated, renter household formation remains structurally elevated by the demographics of aging millennials and housing cost constraints that keep them out of homeownership longer than prior generations.
Parsons is honest about the risk: "those demand-side headwinds remain very real. They may very well pull down absorption going forward." CoStar's Grant Montgomery echoed this in May, noting that H2 2026 projections were lowered "due to softer employment assumptions and the sizeable backlog of excess inventory accumulated across the last two years." This is not a clean, uncomplicated recovery. It is a genuine but cautious improvement against a backdrop of real risk.
Investor takeaway: The demand picture is better than the macro headlines suggested it should be – and the structural drivers are not going away. Even if absorption moderates in H2 2026 as Parsons and CoStar expect, the combination of declining supply and above-historical demand is the definitional condition for vacancy improvement. That combination is now clearly in place.
In simple terms: Despite everything going on – uncertain economy, inflation, choppy job market – more people rented apartments in the first half of 2026 than in any comparable pre-pandemic period. That's not what most people expected. The reason it happened is structural: homeownership is still too expensive for most households, wages have been growing faster than rents, and millions of people need somewhere to live regardless of what the headlines say. That demand isn't going away.
3) Signal Three: Vacancy Declining at the Fastest Pace Since 2021
Parsons identifies this as the clearest evidence of the inflection: three independent data sources – Apartment List, CoStar, and RealPage – each reporting the strongest vacancy improvement metrics since 2021, all simultaneously.
Specifically:
- Apartment List: vacancy improvement in each of the past four consecutive months – the first time since 2021.
- CoStar: the largest Q2 vacancy decline since 2021.
- RealPage: year-to-date vacancy declines topping any year since 2021, with national occupancy at 95.5% – a two-consecutive-quarter improvement (Jay Parsons, July 9, 2026; RealPage Q2 2026).
Three different methodologies, three different sample sets, all pointing to the same conclusion: vacancy is moving in the right direction at a pace that hasn't been seen in three years. That convergence is statistically meaningful. Single data sources can have methodology quirks or sampling biases; when all three agree, the signal is strong.
Parsons correctly frames the caveat: "Apartment vacancy rates remain elevated. There's a big hole to dig out of following the largest supply wave since the 1970s." National vacancy is still above the 10-year average. There is meaningful dispersion between markets – tech-centric coastal metros and some Midwest cities are tighter, while Sun Belt markets that absorbed the most supply remain looser. CoStar's Grant Montgomery notes "the sizeable backlog of excess inventory accumulated across the last two years, which must be absorbed before market conditions can meaningfully tighten." The vacancy improvement is real but still partial. It is the beginning of the recovery process, not the completion of it.
For our Sun Belt focus markets, this is the most important signal. The South is the only U.S. region still experiencing year-over-year rent declines, in part because occupancy there remains below 95% in some submarkets (RealPage Q2 2026). But the direction is clear, and the mechanism is mechanical: as supply deliveries continue to fall and absorption continues to hold, occupancy will tighten toward the levels that restore pricing power. The timeline is 12-18 months in most well-positioned submarkets.
Investor takeaway: Vacancy is the gating variable for rent recovery. There is no meaningful pricing power until vacancy tightens. The fact that three independent data sources all confirm vacancy is now declining at the fastest pace since 2021 means the gating condition is being cleared – systematically, measurably, and consistently.
In simple terms: Vacancy is the key number. When too many apartments are empty, landlords have to offer deals and discounts to attract renters. When vacancy drops, that competition eases and pricing power returns. For the first time since 2021, three different tracking services all agree: vacancy is falling. It's not gone yet – but the trend is clear and it's been consistent for months.
4) Signal Four: Rent Momentum at a Four-Year High
Parsons' fourth signal is the one with the most direct NOI implications: quarter-over-quarter effective rent change in Q2 reached a four-year high, per both CoStar and RealPage.
CoStar's specific figure: effective Q2 rent growth of 1.2% – which Parsons notes is "closer to 2017-19 levels than to 2023-25 levels." This is important context. The 2017-2019 period represents a healthy, normalized apartment market operating under balanced supply-demand conditions. Getting back to those rent growth characteristics – not the pandemic boom, but the healthy equilibrium – is the recovery target. And a single quarter at 1.2% suggests that target is closer than the year-over-year headlines imply.
Parsons adds a particularly useful data perspective on full-year trajectory: "Even if there's flat rent movement in the second half of 2026, we could end the year with around 2% rent growth." The reason: the second half of 2025 was the worst for rents in 15+ years, creating a favorable base effect for 2026 year-over-year comparisons. As long as H2 2026 doesn't repeat H2 2025's severity – which the supply and vacancy data suggest it won't – the headline rent metric will show meaningful improvement almost automatically.
For investors focused on blended rent growth – the combination of new lease pricing and renewal rate increases – the picture is even more favorable than the asking rent data suggests. As we covered in our prior newsletters, CBRE's 2026 analysis shows 57% of all leasing activity is renewals, and renewals consistently price above new lease rates. Concessions, which remain near 11% nationally, are the mechanism suppressing effective rents in the near term – but as vacancy tightens and lease-up competition eases, those concessions burn off and effective rents rise without requiring any asking rent increase at all.
Investor takeaway: The rent momentum signal confirms that the vacancy improvement is translating into real pricing dynamics – not just on paper. A four-year high in quarterly rent change, combined with a favorable base effect for H2 2026 comparisons and ongoing concession burn-off, sets up a meaningfully better NOI environment heading into 2027 than the trailing 12-month data suggests.
In simple terms: Rents went up faster in the second quarter of 2026 than they have in four years. They're not at record highs – but they're moving in the right direction at a pace we haven't seen since before all the supply pressure started. And because last year's second half was so weak, even modest improvement from here will look good in the year-over-year numbers. That's a setup for improving income at well-run apartment communities.
5) Signal Five: Even the Most Oversupplied Markets Are Turning
Parsons saves his most striking data point for last. Austin, Texas – the market that received more apartment supply relative to its size than almost any market in the country and experienced some of the sharpest rent declines as a result – has posted the best momentum improvement of any market in the country in Q2 2026.
The numbers: Austin's year-over-year rent change moved from -7.5% in March 2026 to -3.9% in June 2026 – a 360-basis-point improvement in just three months. Year-over-year rents are still negative in Austin. But the rate of decline has been cut nearly in half, and the trajectory is unmistakably positive. CoStar and Apartments.com's June 22, 2026 Multifamily Momentum Index ranked Austin and San Jose as the top two markets nationally – not because their current fundamentals are the strongest, but because their rate of improvement is the most pronounced.
Parsons is explicit about the interpretation: "When I say 'momentum,' I am looking at the second derivative in YoY rent change." This is precisely the right analytical lens. It isn't asking whether a market is good today – it's asking whether it is getting better faster than anyone expected. And the answer in Austin, Salt Lake City, Denver, Jacksonville, Tampa, and Raleigh is yes. All of these are higher-supplied Sun Belt and Mountain markets where rents are still down year-over-year but declining at a meaningfully slower pace than three months ago.
Tampa's inclusion in the top 10 momentum markets is directly relevant to our portfolio. As Parsons frames it, this confirms that the supply absorption process in the Sun Belt is progressing – that the residual pressure from the 2022-2024 construction wave is burning off ahead of schedule in the markets with the strongest underlying demand fundamentals. Tampa's diverse employment base – healthcare, financial services, tourism, technology – is providing exactly the demand resilience that makes that absorption faster rather than slower.
Investor takeaway: The momentum data is the leading edge of the recovery – it shows where the improvement is happening fastest, which is where the next phase of pricing power will emerge first. Our target markets include several that are posting strong momentum signals (Tampa, and indirectly DFW and Atlanta through their fundamentals). Getting positioned in these markets before the momentum converts to positive year-over-year rent growth is the timing advantage that disciplined early investors capture.
In simple terms: Even Austin – which built more apartments per person than almost anywhere else and saw rents fall the hardest – is now recovering faster than anywhere in the country. That's a powerful signal. When the markets that were most damaged start bouncing back, it tells you the whole sector has turned a corner. Tampa, which is in our portfolio, is in the same top-10 momentum group. The markets where we invest are leading the recovery, not trailing it.
6) What Parsons Gets Right About the Caveats – And Why They Don't Change the Thesis
One of the things that makes Parsons' analysis credible is his explicit acknowledgment of what the data does not yet show. This is worth quoting directly: "To be clear: Apartment vacancy rates remain elevated. There's a big hole to dig out of following the largest supply wave since the 1970s." And: "We're still in a hole, but now we're starting to dig our way out."
The caveats are real and matter for underwriting:
- Year-over-year rent growth is still negative in most higher-supplied markets. The Q2 quarterly improvement is encouraging, but the 12-month trailing figure is still negative in much of the Sun Belt. That will take time to normalize.
- 24.6% of apartments nationally are still offering concessions averaging 7.6% (RealPage Q2 2026). While that's an improvement from peak, it remains well above historical norms and continues to suppress effective rents at the community level.
- Demand headwinds are real. CoStar's Grant Montgomery explicitly stated that H2 2026 projections were lowered due to "softer employment assumptions" and the "sizeable backlog of excess inventory accumulated across the last two years." The recovery is not on rails – macro deterioration could slow or reverse progress.
- The "still in a hole" framing matters. Parsons is not declaring victory. He is identifying a directional inflection in a market that has been moving the wrong way for three years. The hole is real; the exit has begun.
For disciplined investors, these caveats are not reasons to wait. They are reasons to underwrite conservatively – which is exactly what we do. Our deals are built to work through continued supply pressure, modest demand softness, and a gradual rather than rapid concession burn-off. The inflection Parsons describes is upside to our underwriting, not the baseline it depends on.
Investor takeaway: The recovery is real but early. That is precisely the moment when the risk-reward ratio for entry is most favorable – because the improvement is confirmed but not yet priced in. Waiting until the recovery is obvious means competing with more capital for fewer opportunities at higher prices.
In simple terms: The honest answer is: things are getting better, but they're not great yet. Discounts are still being offered. Rents in many Sun Belt cities are still down compared to a year ago. But the trend has clearly turned – and historically, the best time to invest is when you can see the turn happening, before everyone else has rushed back in. That's where we are right now.
7) What the Inflection Means for Investment Timing
Parsons closes with the observation: "I suspect we'll eventually look back at the first half of 2026 as an inflection point of this cycle, or the start of a new cycle." This is a statement worth sitting with. What does it mean to be at an inflection point in a real estate cycle – and why does the timing of that recognition matter for investors?
The answer lies in how cycle recognition and investment pricing relate. When a market is clearly in recovery – vacancy tight, rents growing, concessions gone – every investor can see it, and acquisition pricing reflects it. Cap rates compress. Competition intensifies. Entry points deteriorate. The returns that early investors captured from buying into the improvement accrue to them, not to the investors who waited for certainty.
The most reliable pattern in real estate investing – and one that every cycle eventually confirms – is that the best vintage years are made at or just before the inflection point: when values have already corrected from the peak, when the supply overhang is breaking, and when the demand evidence is improving but not yet widely priced in. CoStar's repeat-sale index showed apartment values approximately 21% below the 2022 peak as of early 2026 (CoStar, cited in our March 6, 2026 newsletter). That correction, combined with the five signals Parsons identifies, creates the setup that Origin Investments describes as the "Class of 2026" vintage – potentially one of the best entry points in a decade.
Wage growth has now topped rent growth for 41 straight months (Jay Parsons, LinkedIn, July 2026) – meaning renter affordability has improved even as rents have softened. New renters entering the market are paying 21-22% of income on rent – a healthy affordability ratio that supports both demand durability and future rent growth capacity. The platform is set.
Investor takeaway: The inflection point Parsons identifies is not just a market observation – it is an investment timing signal. Acting at or near inflection points has historically produced the strongest vintage returns in multifamily. Acting after the recovery is fully confirmed and widely recognized means paying the premium that everyone now understands is justified. The investors who move first, on data, capture the most.
In simple terms: The best time to buy apartments is not when everything looks great – it's when things are clearly getting better but haven't fully recovered yet. That's exactly where we are today. Values are still below peak. Concessions are still happening. But the supply wave is breaking, demand is holding, and vacancies are improving. Waiting for the all-clear signal means paying more for the same asset.
8) How This Connects to Our Five Target Markets
The national inflection Parsons describes plays out with specific local dynamics in our target markets – and in each case, the local story reinforces the national signal:
- Dallas–Fort Worth: DFW combines the nation's strongest job growth metrics (4.8% employment growth per Dallas Fed, April 2026) with a supply pipeline that is clearly turning. The Arbor/Chandan February 2026 Snapshot ranked DFW No. 1 nationally in apartment investment volume at $9.6 billion – institutional capital is already moving in ahead of the inflection.
- Houston: On pace for record total employment at 3.52 million (Greater Houston Partnership, 2026) with healthcare alone adding 14,000 new jobs. Supply is easing on the timeline we identified in our January issue. The combination of employment growth and supply relief is the direct setup for the vacancy improvement Parsons describes.
- Atlanta: Parsons and CoStar/Apartments.com's Momentum Index both confirm the Sun Belt recovery is underway. Atlanta's own metrics – fourth-highest national job growth, slowest multifamily delivery pace in a decade, and MMG Real Estate Advisors' data showing absorption exceeding completions for the first time in three years – put it at the leading edge of the Sun Belt recovery narrative.
- Tampa: Parsons specifically names Tampa in the Top 10 markets for momentum improvement in Q2 2026. That is direct third-party validation of the investment thesis for our Tampa portfolio. The diverse employment base, manageable supply pipeline, and domestic in-migration combine to produce exactly the vacancy and rent trajectory the inflection analysis predicts.
- Charleston: With new multifamily construction starts down 72% from peak (MMG Real Estate Advisors) and Google's $9 billion data center investment arriving in 2026-2027, Charleston is a market where the supply contraction and demand inflection are arriving simultaneously. That timing overlap is precisely the condition that produces the strongest near-term NOI improvement.
Investor takeaway: Our five markets are directly in the path of the national inflection Parsons describes – and in several cases are among its leading examples. The supply, vacancy, and rent momentum signals are not abstract national averages for our portfolio. They are the specific conditions we have been underwriting toward all year.
In simple terms: The cities where we invest aren't bystanders in this recovery – they're leading it. Dallas is attracting record investment capital. Atlanta is absorbing supply faster than new supply is arriving. Tampa is in the top 10 for momentum improvement nationally. Charleston has a supply drought arriving just as Google brings thousands of new employees. These markets aren't hoping for a recovery – they're already in one.
What We're Watching Next
- Q3 2026 absorption data (CoStar and RealPage): If H2 2026 demand holds above pre-COVID norms as Parsons expects – even if below H1's pace – it confirms the structural resilience thesis. A material demand pullback would require underwriting reassessment.
- Concession data in Sun Belt submarkets: The 24.6% national concession rate needs to decline for effective rent improvement to accelerate. Watch for monthly concession tracking from RealPage and Yardi in DFW, Houston, Atlanta, Tampa, and Charleston – the local concession picture matters more than the national average for our specific communities.
- Jay Parsons' September update: Parsons publishes monthly market assessments. His fall update will be the first significant read on whether H2 2026 followed the trajectory he projects or encountered the demand headwinds CoStar's Montgomery flagged.
- CoStar/Apartments.com Momentum Index (next quarterly): The June 22 release ranked Austin and San Jose at the top for momentum improvement. The September release will confirm whether that momentum sustained and whether more Sun Belt markets – including DFW and Atlanta – joined the top tier.
- Wage growth vs. rent growth tracking: Parsons notes wage growth has topped rent growth for 41 straight months – a trend that has rebuilt renter affordability to pre-pandemic levels. If wages continue outpacing rents while rents improve, the affordability runway for further rent growth expands. Watch BLS quarterly employment cost data and Apartment List's rent growth tracker together.
Our 2026 Playbook
- Markets: Dallas–Fort Worth, Houston, Atlanta, Tampa, Charleston – each confirmed in the Parsons framework as markets where the supply cycle is turning and demand fundamentals are strong enough to sustain the recovery.
- Acquisition edge: Below replacement cost with day-one or near-term cash flow. With values still approximately 21% below the 2022 peak (CoStar) and the inflection now confirmed, basis discipline and early timing combine to create the conditions for strong vintage returns.
- Value creation: Livability-first capex: kitchens, LVP flooring, lighting, bath refresh, smart access, pet amenities, package rooms, safety lighting, and landscaping. As concessions burn off and effective rents recover, communities with demonstrated rent premiums from renovations capture more of that improvement than unimproved properties.
- Operations: Renewal-centric mindset, responsive maintenance, transparent fees, and clinical pricing. In an improving market, the communities that have built resident loyalty through excellent service convert the macro improvement into actual NOI first.
- Capital structure: Conservative leverage, assumption-first where it makes sense, and multiple exit paths (hold/refi/sell) based on data – not headlines.
Bottom Line
Jay Parsons is one of the most respected apartment market analysts in the country – and he just said the market has hit an inflection point. Not a boom, not a full recovery: a turn. Supply is finally falling back to pre-pandemic norms after the biggest construction wave in 50 years. Demand has been stronger than expected despite a choppy economy. Vacancy is declining at the fastest pace since 2021 – confirmed independently by three different data services. Rent growth in the second quarter hit a four-year high. And even Austin – the hardest-hit market in the country – is recovering faster than anywhere else. The market is still healing, and honest analysts like Parsons say so clearly: there's still a hole to dig out of. But the digging has started. The supply is easing. The demand is holding. The direction has changed. For investors who understand that the best returns in real estate come from acting at the inflection – not after the recovery is obvious and fully priced in – this is the data they've been waiting for.
If you'd like to be added to our investor list to see future opportunities, please schedule a call with our team.



bhn%2C.png)



vg.png)

d.png)

2.png)
34.png)
7.png)
ujo.png)
_cost%20of%20living.png)
cdvb.png)
fj.png)
fh.png)
hn.png)
rt.png)
uj.png)
vfd.png)
vfdnh.png)

bhn.png)
4e.png)
vcfcb.png)
gbtr.png)

mj.png)
nh.png)

klo.png)
_war.png)
mkj%20(2).png)


ggj.png)

p.png)

ok.png)
-n%5D.png)