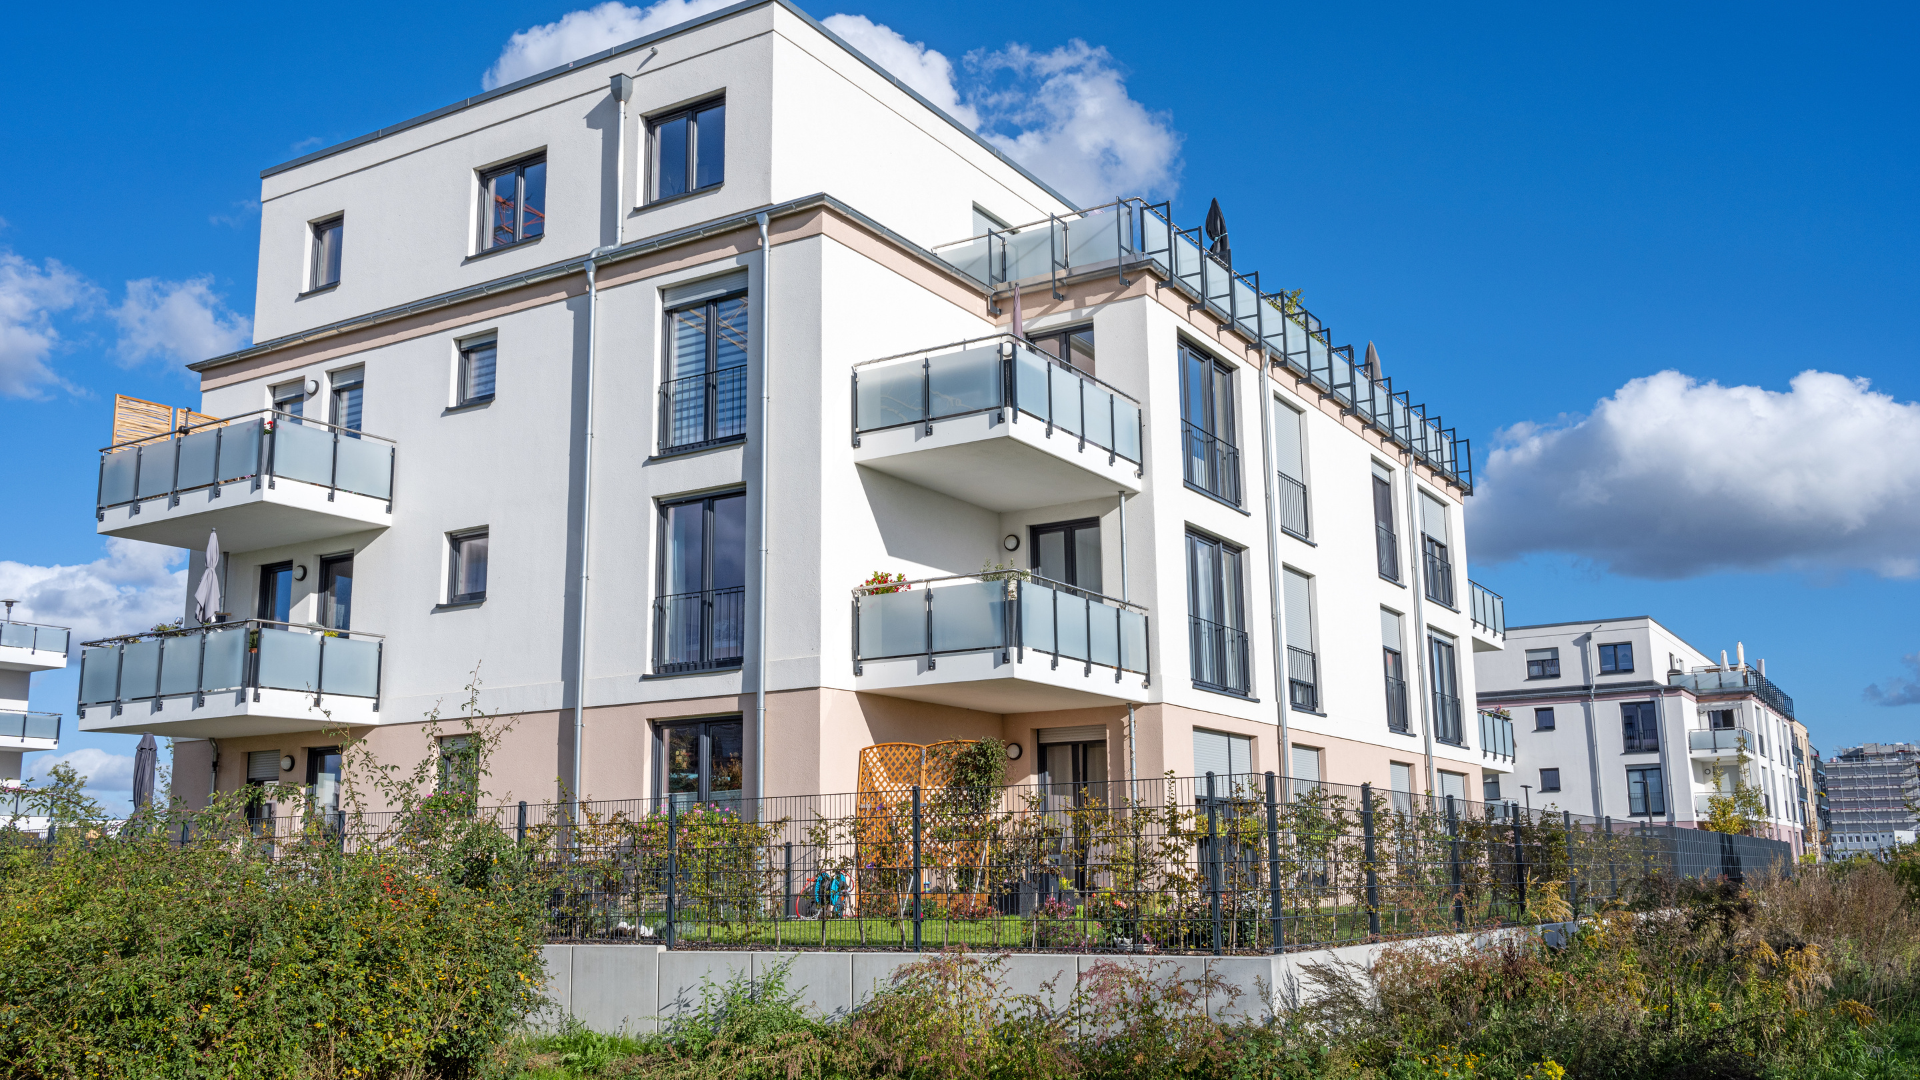
The economy cooled again in the second quarter, and on the surface, that headline sounds like a warning sign. But a closer look at the data tells a more encouraging story for apartment investors: the slowdown wasn't driven by a pullback in household demand, it was driven by weaker government spending. Consumer activity, the force that actually fills apartment units, held up and even accelerated.
For multifamily investors, that distinction matters more than the headline number. Here's what the data shows, and what it means for how we think about the rest of the year.
1) The Data: GDP Cooled, But Not Where It Counts
U.S. GDP grew at an annualized 1.5% in Q2 2026. That's down from 2.1% in the first quarter, and below the 1.8% that economists were expecting (U.S. Bureau of Economic Analysis, Q2 2026 Advance Estimate). It's the second straight quarter of slowing growth. But the composition of that slowdown is the more important story: it was driven primarily by weaker government spending and lower inventory investment, not a broad decline in private demand.
That distinction is not a technicality. Government spending and inventory investment are two of the more volatile, less predictable line items in the GDP calculation.
Government outlays can shift quarter to quarter based on budget timing and fiscal policy decisions that have nothing to do with the health of the private economy. Inventory investment is similarly choppy, businesses build up or draw down stock based on short-term demand expectations, and a drawdown in one quarter often simply reflects strong sales in a prior quarter rather than weakness in the current one. Neither of those categories tells you much about whether a household can afford its rent.
Consumer spending, by contrast, is a far more stable and structurally meaningful number, and it actually accelerated to 2.1% in Q2, up from just 0.4% in Q1, powered by categories like prescription drugs, vehicles, and financial services. Real final sales to private domestic purchasers, a cleaner read on underlying demand that strips out both government spending and inventory swings, jumped to 3.9% in Q2, up from 1.7% in Q1 (BEA, Q2 2026). That3.9% figure is more than double the headline growth rate. It's the number that, if it were the headline instead of the 1.5% print, would have generated a very different set of news stories.
Investor takeaway: A slowing GDP print is not automatically bad news for rental housing. The parts of the economy that drive apartment demand, household spending and private-sector activity, were the parts that got stronger, not weaker. When evaluating a quarter like this, the composition of growth deserves more attention than the growth rate itself.
In simple terms: The economy grew slower this quarter mostly because the government spent less, not because people stopped spending. People spending money is what fills apartments, and that part of the picture actually improved.
2) The Fed Held Steady, and Rate Odds Shifted
The GDP report landed one day after the Federal Reserve held rates steady in a 9-3 vote. Markets responded by nudging the odds of a September rate hike from 58.3% to 61.4%. The 10-year Treasury yield briefly touched 4.71% before settling near 4.65%.
That timing is worth sitting with. A GDP report showing resilient consumer spending, released the day after a Fed decision, is exactly the kind of data point that can tip a divided committee toward a more hawkish lean. Strong household spending is good for rental demand, but it also removes some of the argument for rate cuts, since the Fed's mandate leans on labor market and price stability, and stronger private demand can feed into both wage and price pressure. The market's reaction, nudging hike odds higher rather than lower, reflects that same logic: resilient spending reads as an economy that doesn't yet need monetary support.
For multifamily investors, this is the part of the report that most directly affects deal math. Financing costs, refinance timing, and cap rate assumptions all depend on where the 10-year and the Fed funds rate settle over the next several quarters. A rate environment where hike odds are rising, even modestly, is a different underwriting backdrop than the rate-cut narrative that dominated conversations earlier in the year.
Inflation is the variable to watch here. The Q2 GDP price index jumped 5.7%, a reminder that price pressure hasn't disappeared, and ongoing Middle East tensions have kept energy markets volatile, with implications for both operating expenses and consumer budgets. There's a more encouraging counterpoint, though: the June PCE price index showed headline inflation moderating to 3.7% year-over-year, which offers some relief for stretched renters and helps explain why on-time collections have continued to improve even with rates elevated.
Investor takeaway: Rate expectations remain fluid, and the market is now pricing in a slightly higher chance of a hike, not a cut. That keeps financing costs and cap rate assumptions in focus for underwriting, and it argues for continuing to stress-test deals against a higher-for-longer rate environment rather than underwriting to an assumed cut.
In simple terms: The Fed didn't move rates, but investors are now betting slightly more on the next move being up, not down. Borrowing costs are likely to stay where they are, or edge higher, for now, which means deals need to work on today's financing terms, not on the hope that rates come down.
3) Renter Finances Are Uneven, But Improving
Stronger consumer spending is a tailwind for apartment demand, but the gains aren't evenly distributed. Per Chandan Economics, spending growth this cycle has remained concentrated among higher-income households, leaving the core rental pool, lower- and middle-income earners, still facing real financial constraint, with personal savings rates hovering near multi-year lows. This is an important caveat, and it's one worth being honest about rather than glossing over. National spending strength can mask real dispersion underneath, and multifamily investors who ignore that dispersion risk underwriting the average renter instead of the actual renter in their specific asset class and submarket.
Still, there's a meaningful signal beneath the surface: on-time rent payments improved year over year through June, per Chandan Economics' proprietary data, pointing to modest but real improvement in renter finances, even as July hinted at some seasonal softening. Unlike a spending aggregate, on-time payment rates are a direct measure of whether the household actually occupying the unit can meet its single largest monthly obligation, which makes even a modest improvement a more reliable signal of renter health than a national income statistic that blends every income tier together.
Investor takeaway: Affordability pressure hasn't disappeared, and underwriting should continue to reflect that reality at the lower end of the rent spectrum, particularly for Class C and lower-Class B assets where renter income sensitivity is highest. With spending gains concentrated among higher earners, Class A and core properties may see steadier near-term performance than workforce housing, a divide worth underwriting for explicitly rather than assuming away. That said, the trend line on rent payment performance is moving in the right direction, which supports collections and delinquency assumptions across the portfolio, especially for the workforce-housing, value-add assets that make up the core of our strategy.
In simple terms: Not every renter is feeling the same relief, wealthier households are spending more, while others are still stretched, and that split means higher-end properties may have an easier stretch than workforce housing in the near term. But more renters are paying on time than a year ago, which isa good sign for how apartment communities are performing, even if the recovery isn't happening at the same pace for everyone.
4) What This Means for Underwriting
A mixed macro picture like this one is exactly why we don't underwrite deals around a GDP forecast or a bet on where the Fed moves next. A national print is, at best, a weather report for the broader economy, useful context, but not a substitute for what's happening on the ground. What actually drives an underwriting decision is the demand signal directly beneath the property: local job growth, wage growth, and rent collection trends in the specific submarket.
Investor takeaway: Macro headlines set the backdrop, but the underwriting decision comes down to submarket-level fundamentals, employment, wages, and local collections trends, that hold up regardless of which way the next GDP print or Fed vote goes.
In simple terms: We don't buy or pass on a deal because of one quarter's GDP number. We look at whether people in that specific market are working, earning, and paying rent on time, because that's what actually determines whether the property performs.
What We're Watching Next
- Inflation trajectory: The Q2 GDP price index ran hot at 5.7%, while June PCE moderated to 3.7% year-over-year, watch whether that moderation holds or reverses, since it directly shapes whether the Fed stays on hold or leans toward a hike.
- Energy price pressure: With Middle East tensions ongoing and energy markets volatile, whether rising energy costs feed into both inflation readings and household budgets over the back half of the year.
- Consumer spending durability: Whether the Q2 acceleration in spending holds up, or fades as the effects of slower government spending work through the broader economy in subsequent quarters.
- Rent payment trends: Whether the year-over-year improvement in on-time payments continues into Q3, particularly across our Sunbelt markets, and whether that improvement broadens across income tiers or remains concentrated at the higher end, especially after early signs of seasonal softening in July.
- Rate path clarity: Whether the modest shift toward higher hike odds firms up or reverses as more data arrives ahead of the September FOMC meeting.
Our 2026 Playbook
- Markets: Georgia, South Carolina and Florida markets where employment growth, wage gains, and a shrinking construction pipeline support durable renter demand rather than requiring a favorable national macro print to work.
- Acquisition edge: Below replacement cost with day-one or near-term cash flow, underwritten to perform whether the Fed holds, cuts, or moves toward a hike.
- Value creation: Livability-first capex, kitchens, LVP flooring, lighting, bath refresh, smart access, pet amenities, package rooms, safety lighting, and landscaping, aimed at capturing rent premiums as market conditions continue to normalize.
- Operations: A renewal-centric mindset, responsive maintenance, transparent fees, and clinical pricing, the discipline that converts renter resilience into actual NOI rather than leaving it on the table.
- Capital structure: Conservative leverage, multiple exit paths, and underwriting built around submarket fundamentals rather than a bet on where GDP or the Fed goes next.
Bottom Line
A slower GDP print isn't the same as weaker apartment demand, and this quarter is a good example why. For us, the real signal was never the headline number. It's whether people in our specific markets are working, earning, and paying rent on time. On that front, the data continues to point in the right direction.
If you'd like to be added to our investor list to see future opportunities, please schedule a call with our team.



cdvb.png)



vg.png)

d.png)

2.png)
34.png)
7.png)
ujo.png)
_cost%20of%20living.png)
fj.png)
fh.png)
bhn%2C.png)
hn.png)
rt.png)
uj.png)
vfd.png)
vfdnh.png)
bhn.png)
4e.png)
vcfcb.png)
gbtr.png)

mj.png)
nh.png)

klo.png)
_war.png)
mkj%20(2).png)


ggj.png)

p.png)

ok.png)
-n%5D.png)