The May 2026 housing construction data, released by the U.S. Census Bureau and HUD on June 16, was striking in both its magnitude and its breadth. Total housing starts fell 15.4% in a single month to an annualized rate of 1.177 million units – the lowest reading since May2020 and a miss so large it fell below every single estimate in Bloomberg's economist survey (Bloomberg, Census Bureau/HUD, June 16, 2026). Multifamily starts alone dropped 40.2% – the steepest single-month decline since April 2009 (TD Economics, NAHB).
For apartment investors, the instinct might be to read this as a warning sign: a weak economy, a stressed housing sector, trouble ahead. That reading misses the more important story. The supply wave that has pressured apartment rents, elevated concessions, and compressed NOI for two years is breaking – and it's breaking faster than almost anyone projected. Marcus & Millichap's July 2026 housing analysis frames the consequence directly: declining residential deliveries are expected to ease competitive pressure through at least 2027, giving apartment owners a "clearer path to stronger rent growth" as recent deliveries are absorbed (Marcus & Millichap, July 2026; CRE Daily, July 7, 2026).
Here is the full picture: what the data shows, why it matters for multifamily real estate investing, and how it interacts with every other major theme we've been tracking throughout 2026.
1) The Data in Detail: What Actually Happened in May
The May 2026 housing starts report is one of the most important data releases of the year for apartment investors. Here is a precise breakdown of what the numbers show:
- Total housing starts: 1.177 million SAAR, down 15.4% from April's revised 1.392 million and 8.7% below May 2025. The Census Bureau's own margin of error is ±9.8% – meaning the decline is statistically significant and likely reflects real conditions, not just sampling noise (Census Bureau/HUD, June 16, 2026).
- Multifamily starts: 295,000 annualized – down40.2% from April's 529,000 and 14.2% below May 2025. TD Economics describes this as "the steepest monthly drop since April 2009" (TD Economics, June 16, 2026). NAHB chairman Bill Owens confirmed the reading aligns with builder surveys showing "builder sentiment weakening further in June" (NAHB, June 16, 2026).
- Single-family starts: 882,000 annualized, down 1.9%month-over-month and 6.7% year-over-year. Single-family starts have fallen 6.3% year-to-date compared to the same period in 2025, confirming the pullback is not just multifamily-specific (Build Radicals/NAHB, June 16, 2026).
- Units under construction: 679,000 multifamily – down8.1% from a year earlier and dramatically below the December 2023 peak of over 1 million units. The pipeline clearing is real and accelerating (Build Radicals/Census Bureau).
- Single-family completions: down 16.8% year-over-year to 872,000 – the lowest since mid-2020. Multifamily completions for buildings with five or more units fell 8.4% year-over-year to a 426,000 pace. Fewer completions now means less competitive inventory in the months ahead (Build Radicals/Census Bureau).
- Building permits: down just 0.7% to1.413 million – only 0.2% below the year-ago pace. Single-family permits actually increased 0.6%. The divergence between the sharp starts decline and the modest permits decline suggests some of the May starts drop may be partly technical – particularly the historically unusual multifamily plunge. Mortgage News Daily notes the multifamily drop is "such an aberrant spike in the data" that caution is warranted before reading it as a permanent shift(Mortgage News Daily, June 26, 2026). We'll address this nuance directly below.
- Regional breakdown: The South fell 17.0% month-over-month to 594,000 starts, the West fell 17.2% to264,000, and the Northeast fell 26.8% to 123,000. Only the Midwest saw an increase, up 3.7% to 196,000 (Census Bureau/HUD; Build Radicals). The South's year-to-date combined starts are down 1.6% – directly relevant to our target markets in Texas, Georgia, Florida, and South Carolina.
Investor takeaway: The May data is unambiguously a supply-tightening signal for the apartment market. Even accounting for potential single-month volatility in the multifamily figure, the directional trend across multiple indicators – starts, completions, units under construction, builder sentiment – is consistent and clear. The pipeline of future apartment supply is contracting.
In simple terms: May's housing numbers shocked even the experts – starts fell so much they missed every single prediction that economists made. Apartment construction fell particularly hard. When you combine that with fewer apartments being completed and a shrinking pipeline of projects under construction, the picture is clear: fewer new apartments are coming. For people who already own apartments, that's very good news.
2) Why Builders Are Pulling Back – And Why It's Not Reversing Quickly
Understanding why builders are pulling back is as important as understanding that they are – because the forces driving the slowdown are structural and persistent, not cyclical and temporary.
The build-to-order pivot. Marcus & Millichap's July 2026 analysis identifies the most telling indicator: the share of homes listed for sale but not yet under construction reached a record high in May. This is builders deliberately limiting their spec pipeline – only beginning construction when a buyer (or renter in the case of multifamily) is already committed. For the multifamily sector, this means developers are increasingly requiring pre-leasing thresholds before breaking ground, which reduces the number of projects reaching start stage.
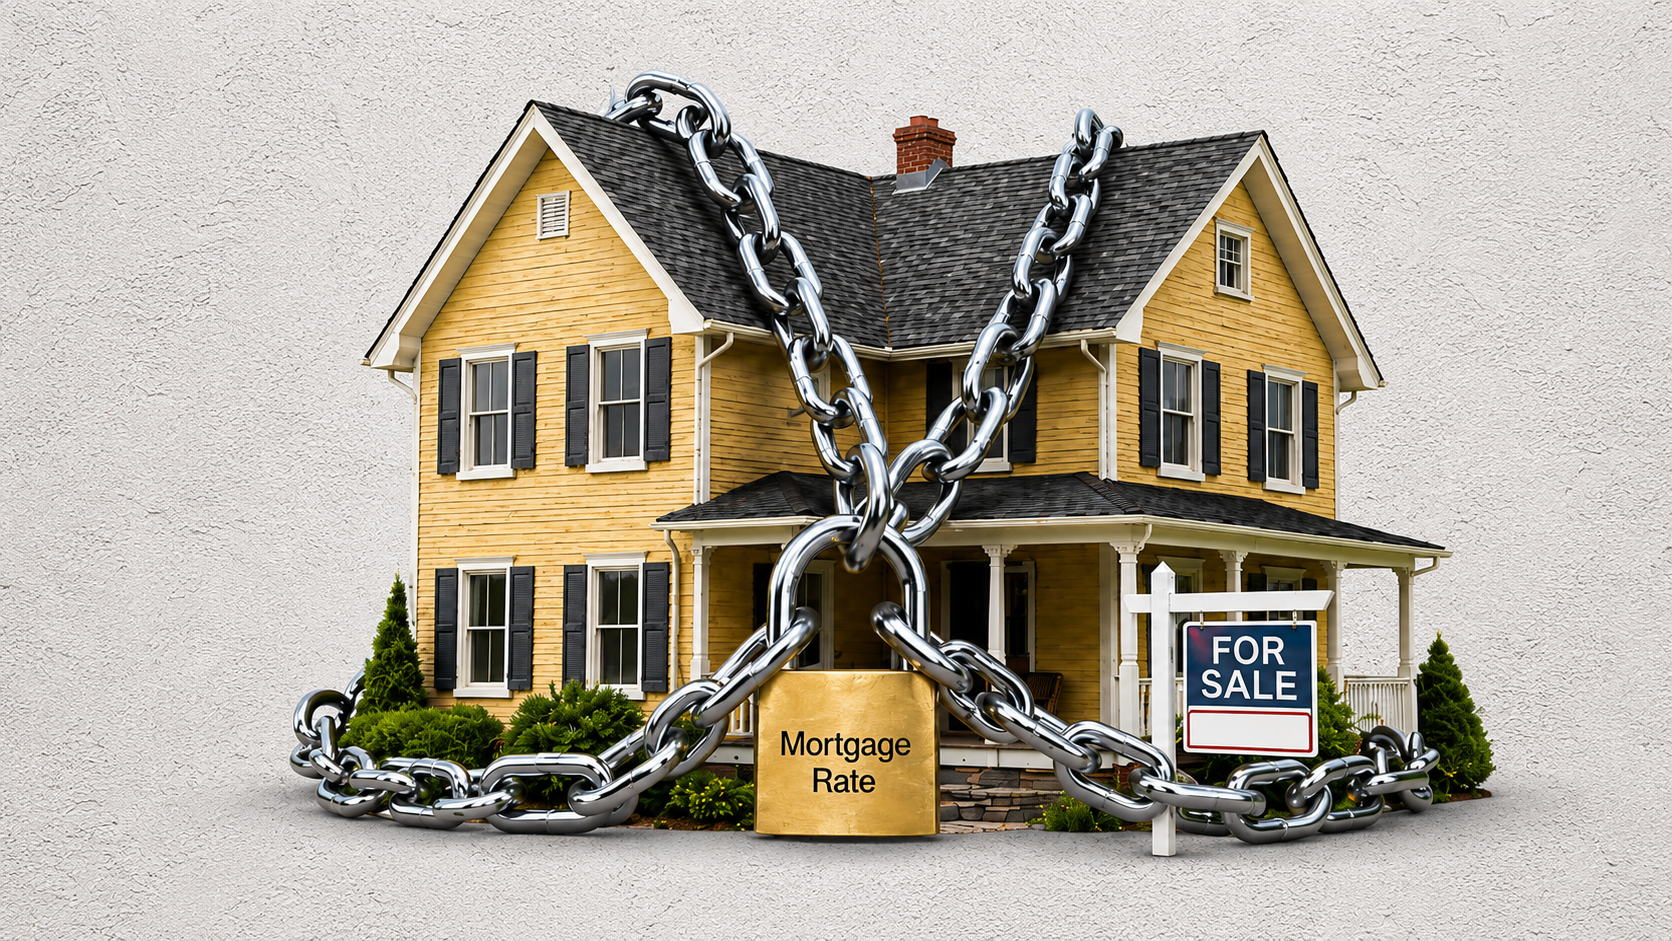
High mortgage rates constraining single-family demand. With 30-year fixed mortgage rates holding above 6.25% and the cost of homeownership remaining nearly three times the cost of renting (Viking Capital2026 Market Report), would-be homebuyers are staying out of the market. Marcus& Millichap reports new-home sales fell to 580,000 annualized in May – the second-lowest in three years – while months of supply climbed to 10.3,the highest since mid-2022. Builders are not starting homes they can't sell.
Elevated construction costs from tariffs and labor pressure. As we've covered extensively throughout 2026, tariffs on steel, lumber, drywall, and aluminum have pushed construction material costs substantially higher. NAHB's Jing Fu confirmed: "builders remain cautious about future construction amid economic uncertainty and affordability pressures" (NAHB, June 2026). The cost to build a new apartment has risen approximately 30% over five years (ULI, February 2026), making the economics of speculative multifamily development harder to justify at current cap rates.
Financing constraints persist. Marcus & Millichap notes that a more predictable borrowing environment would improve construction activity – but persistent inflation and the possibility of additional rate action keep financing costs elevated and underwriting challenging (Marcus &Millichap, July 2026). Construction loans carry floating rates, and developers who have watched rate-driven cost overruns on projects started in 2022-2023 are now more disciplined about project initiation.
Data center competition for labor. A less-discussed but real constraint: the massive data center construction boom – Google's $9billion commitment to South Carolina, large-scale AI infrastructure buildouts nationally – is competing directly for the same skilled trades labor that apartment construction requires. This structural labor competition is adding cost and timeline uncertainty to multifamily projects, further suppressing the appetite for speculative starts.
NAHB's analysis adds important context: year-to-date combined starts are down in most regions (South -1.6%, West -4.9%, Midwest-4.1%, with only the Northeast showing gains at +17.5%). The decline is not concentrated in a single geography or driven by a one-time factor it reflects a – broad and sustained pullback in builder activity.
Investor takeaway: The forces suppressing new construction – high financing costs, elevated material costs, weak for-sale demand, labor competition, and builder risk discipline – are not going away in the near term. This is not a one-month anomaly. It is the result of multiple structural headwinds converging to limit the supply pipeline for 12-24months or longer.
In simple terms: Builders aren't just having a bad month – they're responding rationally to a challenging environment. Mortgages are expensive so fewer people are buying new homes. Construction costs are up because of tariffs. Getting loans to build is harder. And there's fierce competition for construction workers from data center projects. All of those factors point in the same direction: fewer new apartments and homes being built over the next one to two years. That's not reversing quickly.
3) The Important Nuance: How Much of the Multifamily Drop Is Real?
A complete and honest analysis of the May data requires addressing the elephant in the room: is the 40.2% single-month drop in multifamily starts real – or a data artifact?
Mortgage News Daily's analysis is measured on this point: the multifamily drop is "such an aberrant spike in the data that we'd hesitate to read too much into it unless the numbers remain similarly low incoming months (especially given 2+ years of slow, steady upward movement)"(Mortgage News Daily, June 26, 2026). The prior month – April – saw a 14.3%jump in multifamily starts to 529,000. The May reading of 295,000 represents a reversal of that jump and more. Monthly multifamily starts data is volatile by nature due to the lumpy permitting and start timing of large projects.
The more reliable signals are the longer-run trend indicators:
- Multifamily units under construction: 679,000 – down8.1% year-over-year and well below the December 2023 peak of over 1 million. This is a lagging indicator of the true pipeline and doesn't move on single-month noise
- Multifamily permits: 474,000 annualized in May – down2.8% from April but up 2.5% from May 2025. The permits data is more stable than starts and suggests the long-run multifamily pipeline is tightening gradually, not collapsing overnight.
- Builder sentiment declining: NAHB's June survey showed builder confidence weakening further. That qualitative signal, combined with the multistep data (starts, completions, under construction), points to genuine and sustained restraint – even if the magnitude of one month's starts figure is treated with caution.
- Year-to-date starts down in most regions – a consistent signal across geographies that corroborates the monthly picture.
The honest read: the 40.2% single-month drop is likely partly a statistical aberration – one very large project timing or census methodology issue can move this number significantly. But the underlying trend of slowing multifamily supply is well-established, multi-month, and confirmed by multiple independent data series. The direction is clear even if the exact magnitude of any single monthly reading requires context.
Investor takeaway: Sophisticated investors don't trade on single data points – they look for converging signals across multiple series. The convergence here is unambiguous: starts are falling, completions are falling, units under construction are falling, builder sentiment is weakening, and builder behavior is shifting toward demand-confirmed projects. Any one of those signals could be noise. All of them moving in the same direction is a structural trend.
In simple terms: There's an honest question about whether a 40% single-month drop in apartment construction is completely real, or partly a quirk of how the data is counted. That's a fair question – these numbers can be lumpy month to month. But you don't need that specific number to tell the story. Apartments under construction are down 8% from last year. Builder confidence is falling. New projects are being delayed. Every signal is pointing the same way. The trend is real even if one month's number is dramatic.
4) The Path to Concession Burn-Off and Rent Recovery – The 2027 Setup
The supply slowdown data connects directly to the most important forward-looking question for apartment investors: when do concessions burn off and effective rents recover?
Marcus & Millichap's July 2026 analysis frames the timeline explicitly: declining residential deliveries should ease competitive pressure through at least 2027, giving apartment owners room to reduce incentives as existing inventory leases up (Marcus & Millichap, July2026). Here is how that pathway works:
Step 1: Deliveries peak and decline. The record wave of apartment completions – driven by starts from 2021-2023 – has been the primary driver of elevated vacancy, rent pressure, and concessions across Sun Belt markets. With multifamily units under construction at 679,000 and falling, the delivery pipeline is contracting. Fewer new units arriving means less competition for existing communities.
Step 2: Lease-up absorption clears existing inventory. As the new supply that has been delivered continues to lease up – drawing residents into brand-new Class A units with current concession packages – the available inventory in those communities stabilizes. Concession-chasing becomes less rational as occupancy builds. The NMHC data already shows apartment market conditions improving: the NMHC Quarterly Survey of Apartment Conditions reported broadly stable conditions entering Q2 2026.
Step 3: Concessions begin to pull back. Marcus & Millichap reports nationwide apartment concessions remained near 11% in May 2026 – but notes this figure is expected to decline as the supply pipeline clears. Concession burn-off is effective rent growth that doesn't require asking rent increases. When a property offering 6 weeks of free rent reduces to 3 weeks, its effective annual rent rises meaningfully – translating directly into NOI improvement without any market-rate increase.
Step 4: Pricing power returns. Once concessions normalize and vacancy tightens, operators regain the ability to push asking rents at renewal. We've already covered CBRE's data showing 57% of leasing activity in 2026 is renewals – and renewals consistently price at higher rates than new leases. The combination of concession burn-off and renewal pricing improvement is the primary NOI driver for well-positioned apartment communities heading into 2027.
The wage data supports the demand side of this recovery. Marcus & Millichap reports first-quarter wages grew 3.8% year-over-year while median existing-home prices have remained relatively flat since early2025 – a gradual affordability improvement that supports apartment demand without triggering a return of homebuying activity or new construction surges. Existing-home sales rose 3.3% year-over-year in May with first-time buyers at 35% – a healthy sign of demand normalization without overheating.
Investor takeaway: The path from here to stronger rent growth by 2027 is not speculative – it is the mechanical consequence of a supply pipeline that is contracting while demand remains firm. The timeline is 12-18 months: as existing inventory continues to lease up and new deliveries fall, concession pressure eases, and pricing power returns. Communities that are already stabilized, well-operated, and competitively positioned are first in line to capture that improvement.
In simple terms: Here's the simple timeline. There area lot of new luxury apartments that were just built and are still filling up – that's why there are so many deals and free months being offered right now. But as those fill up and fewer new ones open, those giveaways disappear. Rents gradually recover. Based on where construction is right now, that process should play out over the next one to two years. Apartment communities that are already full and well-run are going to see their income improve as the market tightens around them.
5) What This Means for Replacement Cost and the Below-Cost Acquisition Advantage
The construction slowdown has a second, less-discussed implication that directly strengthens the value-add investment thesis: rising replacement cost.
Replacement cost is what it would cost to build the same apartment community from scratch today – land, materials, labor, financing, and developer profit. When construction costs rise and financing remains tight, that number goes up. And when the cost to build a new competing property is higher than what you paid for an existing one, you have a built-in margin of safety that compounds over time.
The May 2026 data reinforces this dynamic from two directions:
- High construction costs are not declining. Tariffs on steel, lumber, and drywall continue to push material costs higher. NAHB confirms building materials are 34% more expensive than December 2020.Labor shortages – amplified by the data center construction boom and immigration enforcement – are keeping wages elevated for skilled trades. The ULI Economist Snapshot confirms multifamily construction costs are up approximately 30% over five years. None of these cost pressures are easing meaningfully.
- Fewer competing units means the existing stock is harder to displace. When new supply is constrained, the residents in existing well-located communities face a limited menu of alternatives. That structural scarcity supports occupancy and pricing power without requiring any macro tailwinds.
- The gap between acquisition basis and replacement cost is widening. If we acquired a community at $100,000 per unit and the replacement cost to build a comparable new unit is now $200,000 to $250,000and rising, the embedded margin of safety in our basis grows with every dollar of construction cost inflation. This is the most durable form of downside protection in real estate – it cannot be taken away by a rate move or a market softness, because it is simply the arithmetic of what it costs to compete with us.
Investor takeaway: The construction cost environment is creating a widening competitive moat for existing, below-replacement-cost communities. Every month that construction costs stay elevated and starts stay suppressed is another month in which the economic barrier to new competition grows – making well-located existing assets more valuable, not less.
In simple terms: Think of it this way: if we bought an apartment community for a certain price, and it now costs twice as much to build the same thing new, we have a major financial advantage. Nobody can undercut us by just building cheaper – because building new is expensive and getting more expensive. That gap between what we paid and what it would cost to build a competing property is our margin of safety. The supply slowdown and high construction costs are making that margin wider, not narrower.
6) How This Plays Out in Our Five Target Markets
The national data is the backdrop. The investment thesis lives at the submarket level – and our five markets each have specific dynamics that make the supply slowdown story particularly compelling right now.
- Dallas–Fort Worth: DFW led the nation in apartment investment volume in 2025 at $9.6 billion (Arbor/Chandan Economics). The South region's year-to-date combined starts are down 1.6% (Build Radicals/Census Bureau) – with DFW submarkets that saw aggressive deliveries in 2023-2024 now beginning to absorb that supply. With Dallas employment growing at 4.8% (Dallas Fed, April 2026) and Goldman Sachs building an 800,000 sq ft campus, the demand side remains firm even as the competitive supply pipeline contracts.
- Houston: Houston is on pace for record total employment at 3.52 million (Greater Houston Partnership, 2026). With healthcare adding14,000 new jobs and the city's supply delivery pace already moderating toward pre-pandemic norms (as we noted in our January 2026 issue), the combination of firm demand and a contracting supply pipeline sets up Houston as one of the strongest near-term NOI improvement markets in the Sun Belt.
- Atlanta: Marcus & Millichap projects 19,000 new jobs in Atlanta in 2026 – fourth nationally – while new apartment deliveries fall to the slowest pace in over a decade. MMG Real Estate Advisors' 2025Atlanta Forecast shows absorption exceeding new completions for the first time in nearly three years. With the South's new supply in decline and Atlanta's demand fundamentals among the strongest in the country, this is arguably the most favorable supply-demand setup in our entire portfolio right now.
- Tampa: Tampa's domestic in-migration-driven demand is running ahead of a supply pipeline that is more manageable than Miami or Fort Lauderdale. Newmark's Q3 2025 data shows Tampa delivering 6.5% annualized multifamily returns – outperforming major Sun Belt peers. As the South's overall starts decline and completions fall, Tampa's relatively balanced supply picture becomes increasingly favorable.
- Charleston: South Carolina's combined starts are part of the South region's 1.6% year-to-date decline (Build Radicals). MMG's 2025Charleston Forecast shows new multifamily construction starts down 72% from peak with completions expected to fall 73% in 2025 – a supply contraction so dramatic that even moderate demand growth will drive meaningful occupancy gains. Google's $9 billion data center investment for 2026-2027 is creating high-wage professional renter demand precisely as the supply pipeline approaches its lowest point.
Investor takeaway: The national supply slowdown is a tailwind for our entire portfolio – but it is strongest in the specific markets where the combination of contracting pipelines and robust employment growth are most pronounced. Atlanta, Houston, and Charleston all present particularly compelling setups where supply is declining faster than demand, which is the definition of a tightening market.
In simple terms: The supply slowdown is happening everywhere, but it matters most in the cities with the strongest job markets – because that's where demand keeps coming in even as fewer new apartments open. All five of our markets fit that description. In Atlanta especially, new apartment construction has essentially stopped while job growth continues. That combination doesn't last forever without pushing rents higher.
7) Risks to Monitor – Keeping the Analysis Honest
A complete investor analysis requires acknowledging the risks to this thesis:
- Single-month volatility in multifamily starts. As Mortgage News Daily notes, the 40.2% drop is unusually large and may partially reverse in June. If starts rebound significantly, the supply contraction narrative weakens. Watch the next two to three months of data before drawing firm conclusions from the May reading alone.
- Permits divergence. Building permits – the leading indicator for starts – fell only 0.7% in May, and single-family permits actually increased. If permits remain stable while starts are depressed, it could mean the starts plunge is temporary timing rather thana permanent shift. The permits data deserves close monitoring alongside starts.
- Rate and macro uncertainty. Marcus & Millichap specifically flags that persistent inflation or additional rate hikes would keep financing costs elevated and pressure underwriting in markets still digesting large volumes of new supply. Our target Sun Belt markets are most exposed to this risk, as they absorbed the most new apartments during the 2022-2025 wave.
- Concession timing. The 11% national concession rate confirms that the competitive supply overhang hasn't cleared yet. Concession burn-off is a 2H2026-2027 story, not an immediate one. Investors should not model rapid rent recovery – they should model gradual effective rent improvement as the pipeline clears over 12-18 months.
Investor takeaway: The supply slowdown thesis is sound and well-supported across multiple data series – but the precise timing and magnitude of the recovery depends on variables that are still evolving. Conservative underwriting that models gradual improvement rather than rapid recovery is the appropriate response. That is exactly how we approach every deal.
In simple terms: We want to be honest: this is a positive trend, not a guarantee. There's a chance the big May drop in apartment construction was partly a counting quirk and will bounce back. Concessions haven't gone away yet – they're still running near 11%. The improvement is real, but it will take a year or two to fully play out. We don't build our deals around best-case scenarios – we build them to work through a range of conditions and reward patience.
8) What We're Watching Next
- June housing starts (due mid-July): The June Census Bureau release will be the first real test of whether the May multifamily plunge was a statistical anomaly or the beginning of a more sustained contraction. A rebound to 400,000+ multifamily starts would suggest May was partly noise; a reading below 350,000 would confirm the trend.
- Monthly NAHB builder sentiment surveys: Builder confidence deteriorated further in June. Watch for any stabilization or reversal in the HMI (Housing Market Index) as a leading signal for future starts.
- Multifamily units under construction (Census Bureau):This is the most stable indicator of the true pipeline. The decline from 1 million+ in December 2023 to 679,000 in May 2026 is the number that matters most for the 12-18 month supply outlook.
- Concession data in target submarkets: Marcus & Millichap tracks concessions nationally at 11%. We watch the submarket-level concession data in DFW, Houston, Atlanta, Tampa, and Charleston monthly – because the national figure masks meaningful local variation. In markets where the supply wave has largely cleared, concession pullback is already underway.
- New-home sales and months of supply: If months of supply declines from the current 10.3 toward more normal levels of 5-6, it would signal improving builder confidence and potentially the beginning of a new construction cycle. That would be the signal to watch for future supply re-acceleration – not an immediate concern, but the variable that defines the duration of the current favorable window.
Our2026 Playbook
- Markets: Dallas–Fort Worth, Houston, Atlanta, Tampa, Charleston – Sun Belt growth markets where the supply pipeline is contracting while employment and renter demand remain firm.
- Acquisition edge: Below replacement cost with day-one or near-term cash flow. With construction costs elevated and starts at a six-year low, the gap between our acquisition basis and the replacement cost of a competing new property is as wide as it has been in years.
- Value creation: Livability-first capex: kitchens, LVP flooring, lighting, bath refresh, smart access, pet amenities, package rooms, safety lighting, and landscaping. Improvements that support above-market renewal pricing as the concession environment normalizes.
- Operations: Renewal-centric mindset, responsive maintenance, transparent fees, and clinical pricing. As the supply overhang clears, operators who have built resident loyalty through excellent service will capture concession burn-off and renewal pricing improvement first.
- Capital structure: Conservative leverage, assumption-first where it makes sense, and multiple exit paths (hold/refi/sell) based on data – not headlines.
Bottom Line
May 2026 housing starts fell to their lowest level since the pandemic – and the drop was so large it surprised every economist who had forecast it. Apartment construction fell especially hard, down more than 40% in a single month. There's a fair question about whether that specific number is fully reliable given how volatile monthly construction data can be – but the broader trend is clear: fewer new apartments are being built, the pipeline of projects under construction has been falling for two years, builder confidence is weakening, and developers are being cautious about starting new projects without confirmed demand. For existing apartment communities, this is good news. The supply wave that created all those concessions and rent discounts is washing out. As the new apartments that were built get filled up and fewer new ones arrive, the deals disappear and rents recover. Marcus & Millichap expects that process to play out through 2027. Combined with rising construction costs that make it more expensive to compete with existing communities, and strong demand from renters who can't afford to buy homes, the apartment market appears to be turning in the right direction. The window to acquire well-located communities before that improvement is fully priced in is still open – but it's narrowing.
If you'd like to be added to our investor list to see future opportunities, please schedule a call with our team.



hn.png)



vg.png)

d.png)

2.png)
34.png)
7.png)
ujo.png)
_cost%20of%20living.png)
cdvb.png)
fj.png)
fh.png)
bhn%2C.png)
rt.png)

uj.png)
vfd.png)
vfdnh.png)

bhn.png)
4e.png)
vcfcb.png)
gbtr.png)

mj.png)
nh.png)

klo.png)
_war.png)
mkj%20(2).png)


ggj.png)

p.png)

ok.png)
-n%5D.png)